
MID AND SOUTH DOWN HOUSE PRICES DROP DESPITE INCREASE IN SALES VOLUME.
 The overall average house price in mid and south Down decreased slightly in the second quarter of 2017 even though the number of transactions was at the highest recorded level since the property crash ten years ago, according to Ulster University’s latest Quarterly House Price Index report.
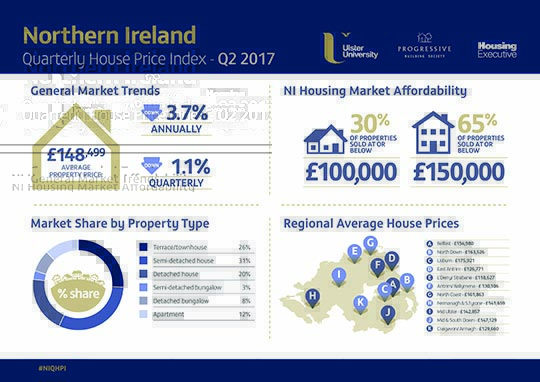
Ulster University’s research is produced in partnership with the Northern Ireland Housing Executive and Progressive Building Society. Analysing the performance of the mid and south Down housing market between April – June 2017, the report reveals an overall average house price of £147,129 down from £158,527 in Q1.
The volume of transactions in the survey in Northern Ireland is 2,372.
The research showed a number of factors could be behind this outcome including the mix of properties by type and age in this survey and wider macroeconomic and political factors. Uncertainty arising from Brexit, the outcomes of the UK general election, the present lack of agreement on the formation of the Northern Ireland Executive, slower growth rates in the national and local economy and a number of pessimistic economic forecasts over the short to medium term are all recorded as contributing factors.
Lead researcher, Professor Stanley McGreal from Ulster University said: “This latest survey has mixed messages regarding the health of the Northern Ireland housing market – transaction levels are high suggesting a strong market in the second quarter of 2017 however this optimism is not reflected in average prices which are generally more subdued.”
Michael Boyd, Progressive Deputy Chief Executive and Finance Director added: “This report reflects a mixed picture for the Northern Ireland Housing sector with the strongest volume of transactions for over a decade but a weighted decrease in the average sale price falling by 1.1% over the quarter.
“There is no doubt that wider economic and political factors are having an impact including uncertainty following the triggering of Article 50, wage growth lagging behind inflation and the potential for the rise in interest rates.
“However as one of the most affordable regions of the UK, confidence remains within the sector and this is supported by affordability, a stable local labour market and economic growth of 0.3% in the early part of 2017. Just how the external political and macroeconomic issues play out remains to be seen but it is clear that these will be reflected in the level of growth of the local housing market in the months ahead.”
Karly Greene, Head of Research and Equality at the Housing Executive, said:“Although the most recent report indicates a slight fall in average house prices by comparison with the equivalent period in 2016, it is important to bear in mind the wider context.
“The ongoing political and economic uncertainty mean there is relatively little impetus for house price growth, but the strong level of transactions suggests that the current pricing structure in the market is enabling many households – particularly first time buyers – to purchase homes at affordable prices.”
Market share by type of property
| Market sector | Market Share |
| Terrace/townhouse | 26% |
| Semi-Detached house | 31% |
| Detached house | 20% |
| Semi-Detached Bungalow | 3% |
| Detached Bungalow | 8% |
| Apartment | 12% |
Performance by Property Type
| Market sector | Annual % Change | Quarterly % Change | Average Price Q2 2017 | Average Price
Q1-Q2 2017 |
| Terrace/townhouse | 0.3% | 1.7% | £102,466 | £101,753 |
| Semi-detached house | -5.5% | -1.9% | £140,977 | £142,155 |
| Detached house | -3.4% | -2.5% | £233,976 | £234,029 |
| Semi-detached bungalow | 0.3% | 3.5% | £116,177 | £114,509 |
| Detached bungalow | -6.3% | -3.4% | £172,163 | £175,031 |
| Apartment | -4.5% | 1.4% | £119,513 | £118,814 |
Performance by Region
| Location | Average Price
2017 Q2 |
Average Price
2017 Q1-Q2 |
| Northern Ireland – All | £148,499 | £150,050 |
| Belfast-All | £154,980 | £155,573 |
| North Belfast | £99,857 | £103,758 |
| South Belfast | £203,120 | £205,345 |
| East Belfast | £162,364 | £168,119 |
| West Belfast | £123,400 | £130,884 |
| North Down | £163,526 | £172,614 |
| Lisburn | £175,921 | £173,814 |
| East Antrim | £126,771 | £128,408 |
| L’Derry/Strabane | £118,627 | £122,230 |
| Antrim Ballymena | £130,106 | £134,237 |
| Coleraine/Limavady/North Coast | £161,863 | £151,484 |
| Enniskillen/Fermanagh/S.Tyrone | £141,659 | £129,449 |
| Mid Ulster | £142,857 | £135,754 |
| Mid and South Down | £147,129 | £158,527 |
| Craigavon/Armagh | £129,660 | £136,053 |